If frequency calculation are present in the filename.OUT
CRYSTAL03 output file, MOLDRAW creates the file filename_FREQ.MOL under the actual directory and two
new options becomes available in the View menu.
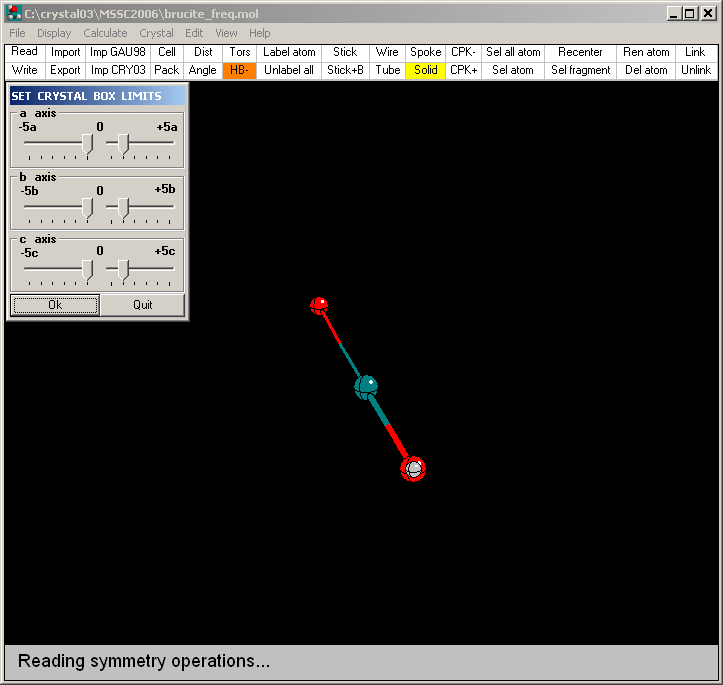
For very small unit cells it is hard to understand the vibrational modes as
too few atoms are involved. In these cases go to the Crystal
menu and chose Make Box option. Please also note that,
for the way in which MOLDRAW treats periodicity, the options Make
cell and Make box are inactive.
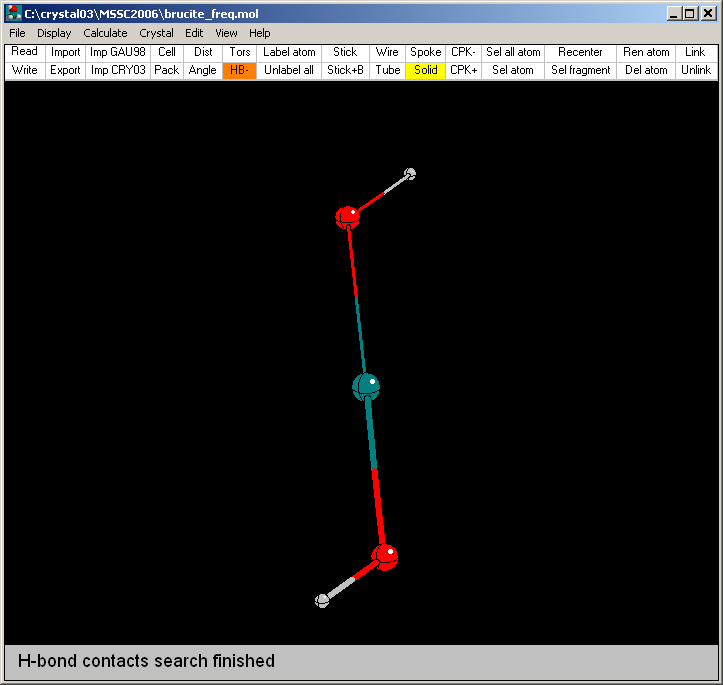
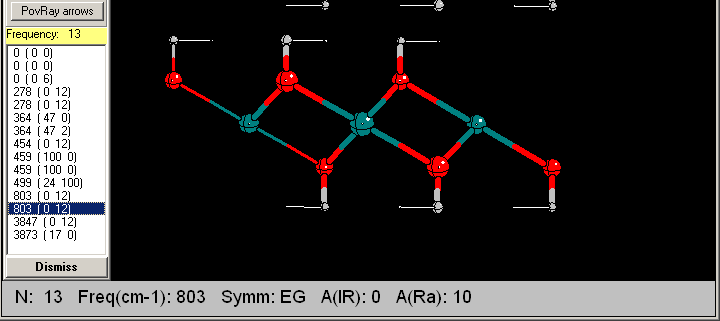
For instance let us consider the brucite (magnesium dihydroxide) case.
After reading the CRYSTAL03 frequency output file, the unit cell consists
of only 5 atoms, as shown on the left.
In order to view a larger piece of the brucite crystal, the
(Crystal--->Make box) menu is selected and the default
choices are taken. Due to different ways in which MOLDRAW and CRYSTAL03
are handling crystal symmetry the (Crystal--->Make
packing) menu as well as the Pack option in the toolbar are inactive.
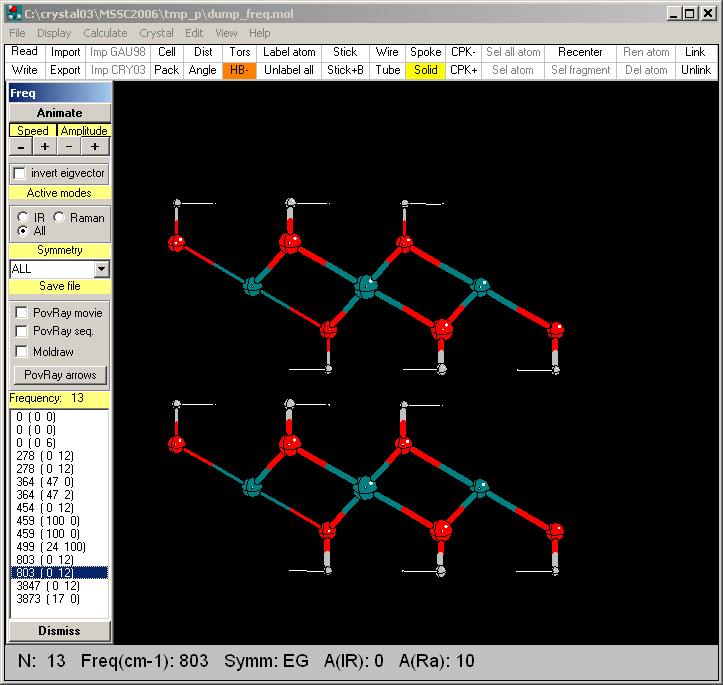
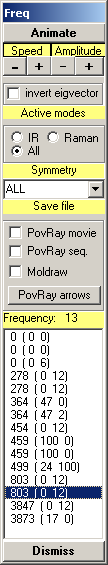
Visualize the normal modes
On the generated crystal, select the (View--->Normal
modes) menu. A popup form containing various controls to view and
render the vibrational frequencies should appear.
Each mode can be selected and the associated atomic displacements
displayed. By clicking the animate button the
mode
will be animated. Speed of the motion and
amplitude of the displacements are also
tunable. Modes can be displayed on a symmetry base.
Speed of the animation can be incresead/decreased by the +/- buttons. The amplitude of each eigenvector can be
increased/decreased by the +/- buttons.
The versus of each atomic displacement can be changed by
clicking on the invert eigenvector dialog.
Modes can be selected as a function of their IR and Raman activity, or
by selcting a given symmetry representation.
PovRay files can
be saved as a unique pseudo PovRay
movie, or as a PovRay sequence
of separate files along each normal mode or each mode can be saved as a
PovRay arrows very similar to the picture
available in MOLDRAW.
The IR and RAMAN intensities are normalized to 100 within the
frequency dialog, whereas the true value is shown in the bottom line
of the main window (click the picture on the
left).
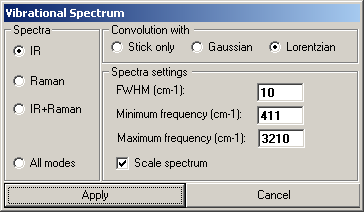
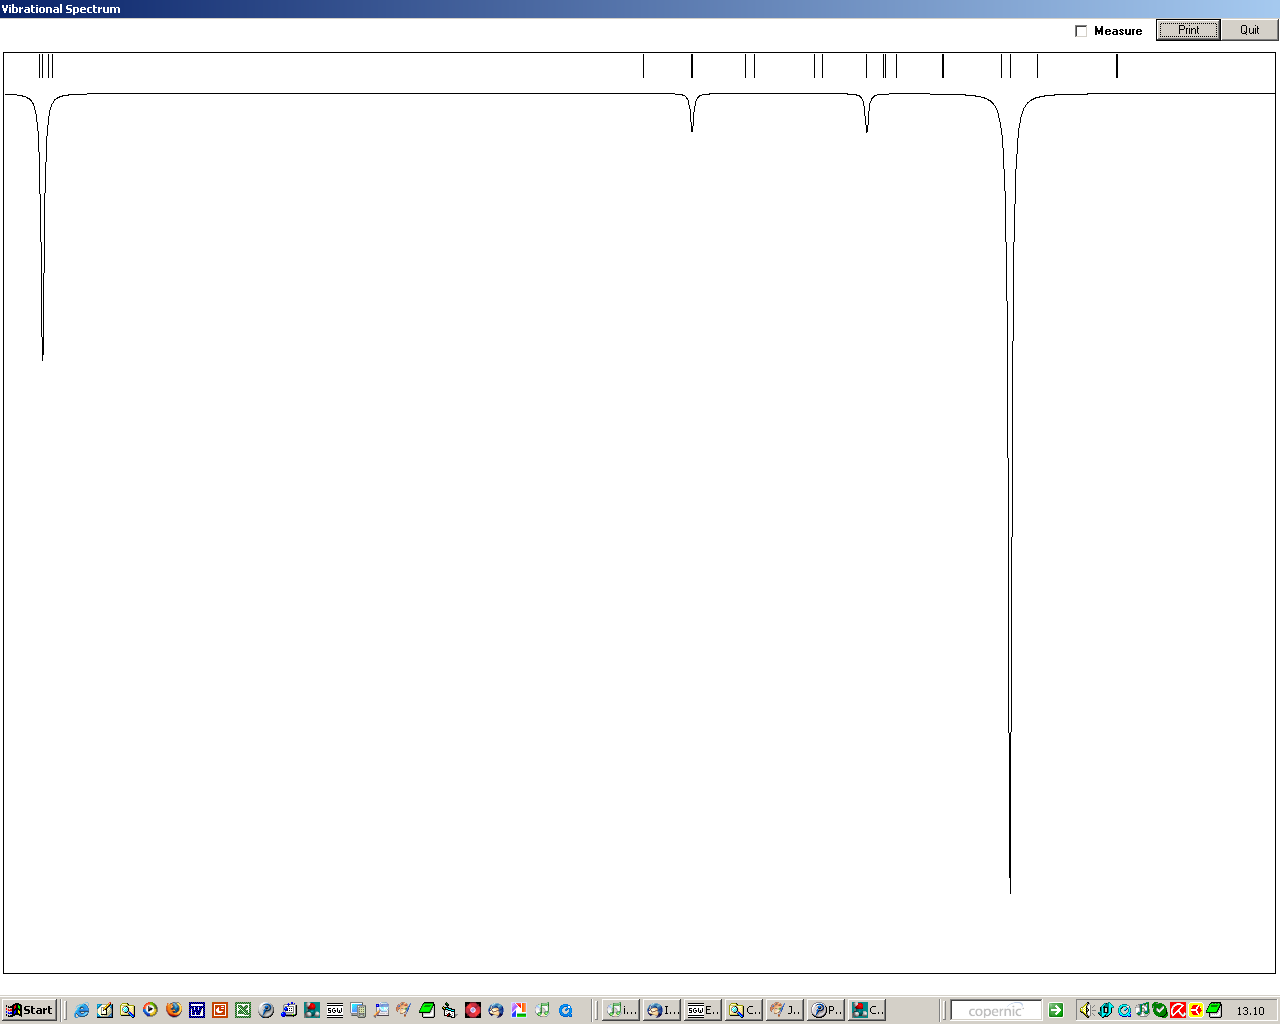
Generate the vibrational spectrum
Select the (View--->Vibrational spectra) menu. The
vibrational spectrum (IR, Raman or both) is rendered on the screen. An
ASCII XY file called dump_freq.SPT containing the spectrum in
the X(frequency in reciprocal cm) Y(normalized intensity) is also generated in
the tmp_p directory. The spectrum is made by using either Gaussian or Lorentzian
convolution. The maximum width at half height of each Gaussian/Lorentzian can be
chosen by the user.