| Reading a geometry optimization output file
Click on the Imp Gau98 label of
the toolbar and select the Gaussian output file name.
Each geometry nnnn computed during the optimization process is saved
as a G98_nnnn.MOL file a the TMP_P directory created under the
local directory. The nnnn digit identifies the nnnn
geometry in the optimization process. If the geometry optimization has
reached final convergence the file FILENAME.RES (FILENAME is the name of the
actual structure) is written in the TMP_P directory.
It contains the final optimized structure in the Gaussian98 format archive.
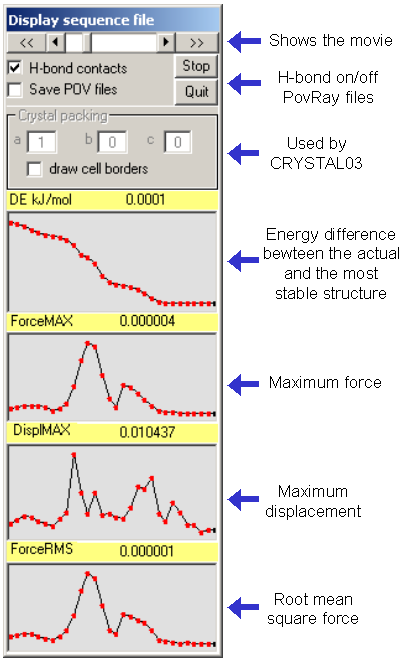
MOLDRAW allows to step through and visualize each geometries computed during
the geometry optimization along with total energy value, gradient norm, and
maximum displacement.
|
|
The forward/backward buttons allow to view the sequence of the
structures in a continuos process, as in a movie.
Each structure is also saved as a MOL file in the TMP_P subdirectory.
For instance, if the name of the original Gaussian file is Molecule.OUT and
three structures are present as a result of the
optimization then three files named g98_0001.mol, g98_0002.mol and
g98_0003.mol are written in the TMP_P
directory. |
|
|
Four ASCII files are also written called:
Molecule.LOG_DISPLMAX_graph.dat
Molecule.LOG_ENERGY_graph.dat
Molecule.LOG_FORCEMAX_graph.dat
Molecule.LOG_FORCERMS_graph.dat
each containing the corresponding data from the ab-initio calculation
in a format ready to be used by any plotting programs.
A given structure can also be visualized by clicking each red dot on
any curve.
Hydrogen bond contacts can be turned on/off by selecting the proper
option button.
|
The various structures in the sequence can also be saved as PovRay files to be processed by the PovRay program. In this case
files named g98_0001.pov, g98_0002.pov and g98_0003.pov are written in the TMP_P
directory to be processed by the PovRay program. To see how to trasform a
sequence of PovRay files in an AVI movie please click this link.
A geometry optimization sequence can be re-opened without converting again
the Gaussian98 output file by the (File--->Open sequence...)
menu and selecting the file G98_SEQ.SEQ file located in the TMP_P
directory.
You are here: Home-Navigate-Topics-Gaussian98-Optimization
Previous Topic: Export input Next Topic: Frequencies
|