| Reading a frequency calculation output file
If frequency calculation are present in the filename.OUT or
.LOG or .QFI Gaussian output file, MOLDRAW creates the file filename-G98_FRE.MOL under the TMP_P directory. This
file is not automatically read by MOLDRAW at the end of the conversion process
and should be explicitly read in order to display the normal modes of vibration
and the corresponding spectra. After reading the filename-G98_FRE.MOL
two new option becomes available in the View menu.
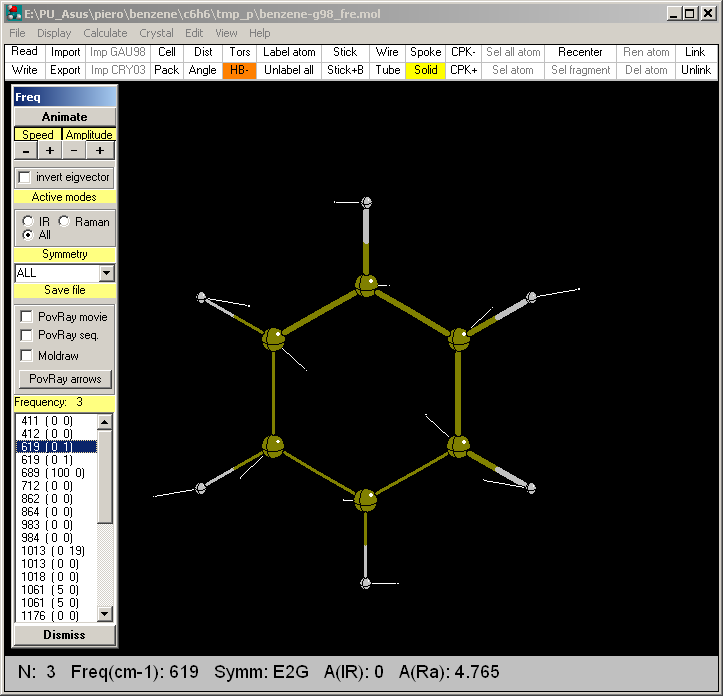
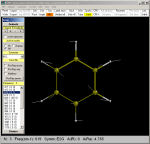
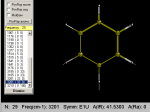
Visualize the normal modes
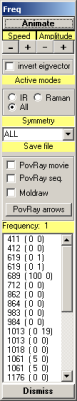
Select the (View--->Normal modes) menu. A popup form
containing various controls to view and render the vibrational frequencies
should appear.
|
|
Each mode can be selected and the atomic displacements displayed. By
clicking the animate button the mode will be
animated. Speed of the motion and amplitude of the displacements are also tunable.
Modes can be displayed on a symmetry base. |
|
|
Speed of the animation can be incresead/decreased by the +/- buttons. The amplitude of each eigenvector can be
increased/decreased by the +/- buttons.
The versus of each atomic displacement can be changed by
clicking on the invert eigenvector dialog.
Modes can be selected as a function of their IR and Raman activity, or
by selcting a given symmetry representation.
PovRay files can
be saved as a unique pseudo PovRay
movie, or as a PovRay sequence of
separate files along each normal mode or each mode can be saved as a PovRay arrows very similar to the picture
available in MOLDRAW.
|
|
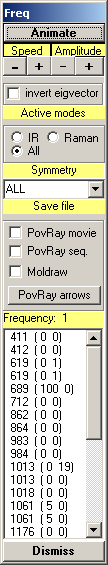
The IR and RAMAN intensities are normalized to 100 within the
frequency dialog, whereas the true value is shown in the bottom line
of the main window (click the picture on the
left). | |
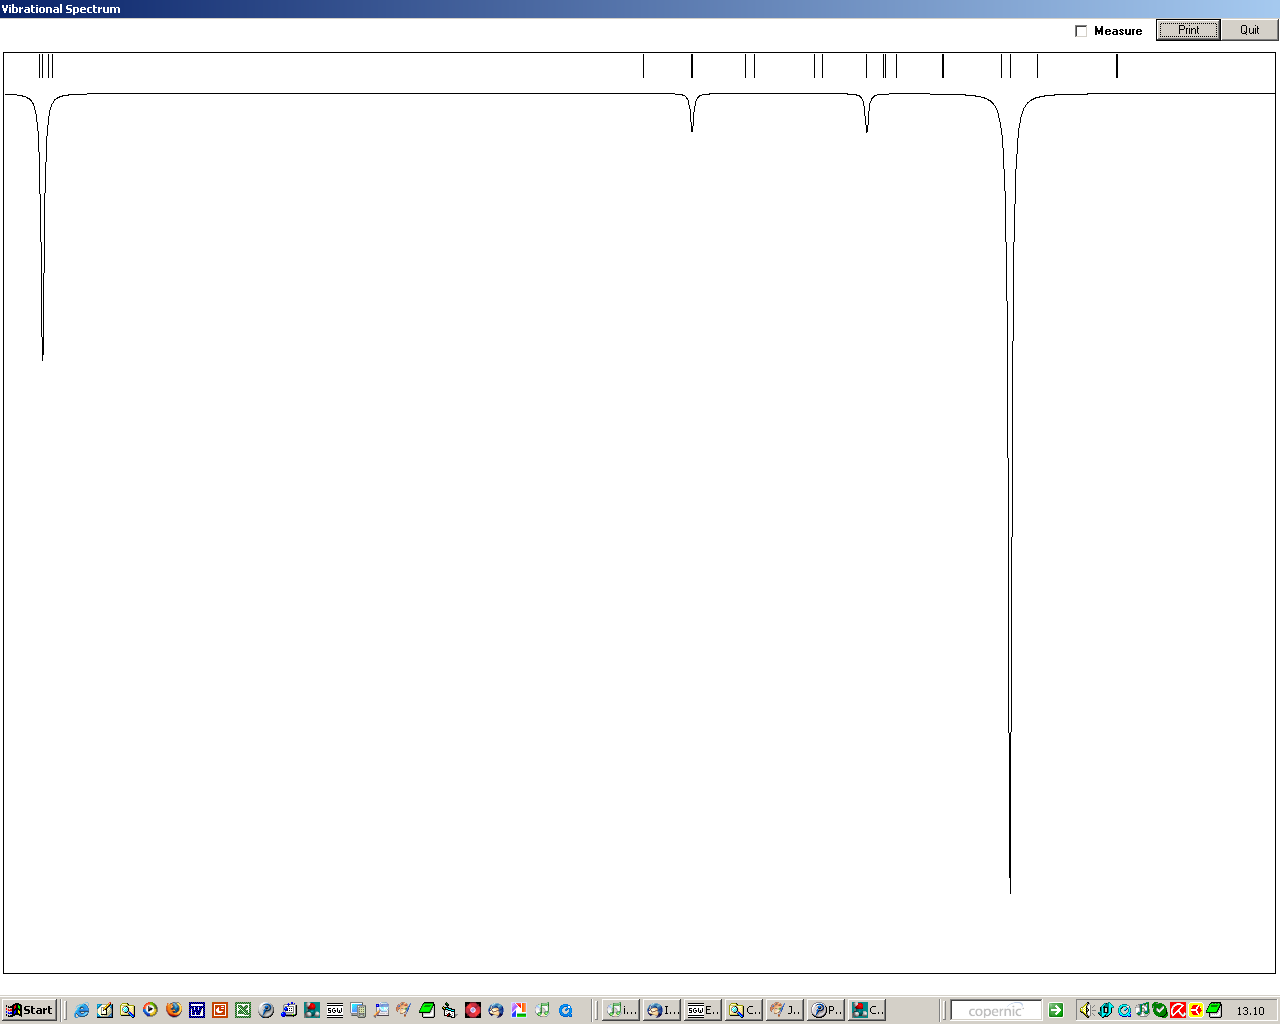
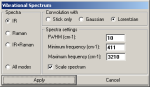
Generate the vibrational spectrum
Select the (View--->Vibrational spectra) menu. The
vibrational spectrum (IR, Raman or both) is rendered on the screen. An
ASCII XY file called Filename-g98_fre.SPT containing the spectrum in
the X(frequency in reciprocal cm) Y(normalized intensity) is also generated in
the tmp_p directory. The spectrum is made by using either Gaussian or Lorentzian
convolution. The maximum width at half height of each Gaussian/Lorentzian can be
chosen by the user.
|
Vibrational spectrum dialog |
IR spectrum of benzene |
RAMAN spectrum of benzene |
You are here: Home-Navigate-Topics-Gaussian98-Frequencies
Previous Topic: Optimization Next Topic: Import input
|